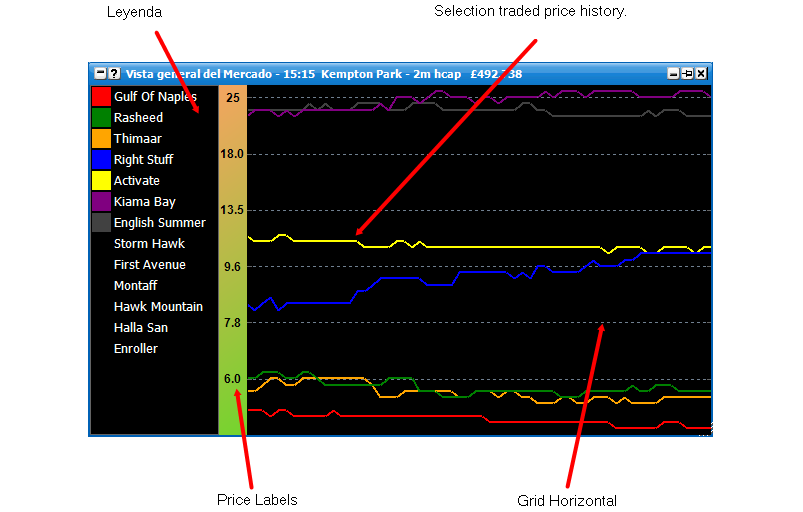
Grafico de Visualizacion General del Mercado
The Grafico de Visualizacion General del Mercado shows an overall long-term historical view of the market based upon last traded price. This enables you to see at a glance the price history for either the entire market, or just those selections you specify. By default the Grafico de Visualizacion General del Mercado is switched off. You can enable by selecting Grafico de Visualizacion General del Mercado from the Menu principal de la Barra de Informacion. To switch whether a selection displays on the graph, click on its name in the legend. To change the colour of a selection, click on its colour in the legend.
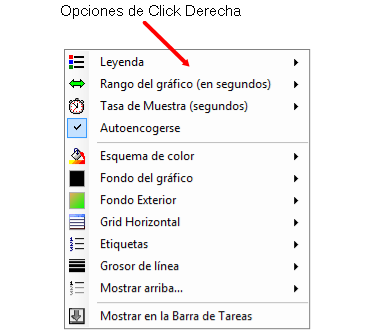
By right clicking anywhere in the window it brings up the various options for the Grafico de Visualizacion General del Mercado.
|
|